Data is king. We use it to get to know more about a subject, to prevent potential uncertainties, to save time, money, and other critical resources. But despite its significance, we know that looking at large bulks of data can be overwhelming, especially if you do it on a daily basis.
When it comes to monitoring indoor air quality, we always want to make sure that accessing and visualizing air quality information is and will always be smooth and easy. That’s why we’ve created the uHoo Business Dashboard.
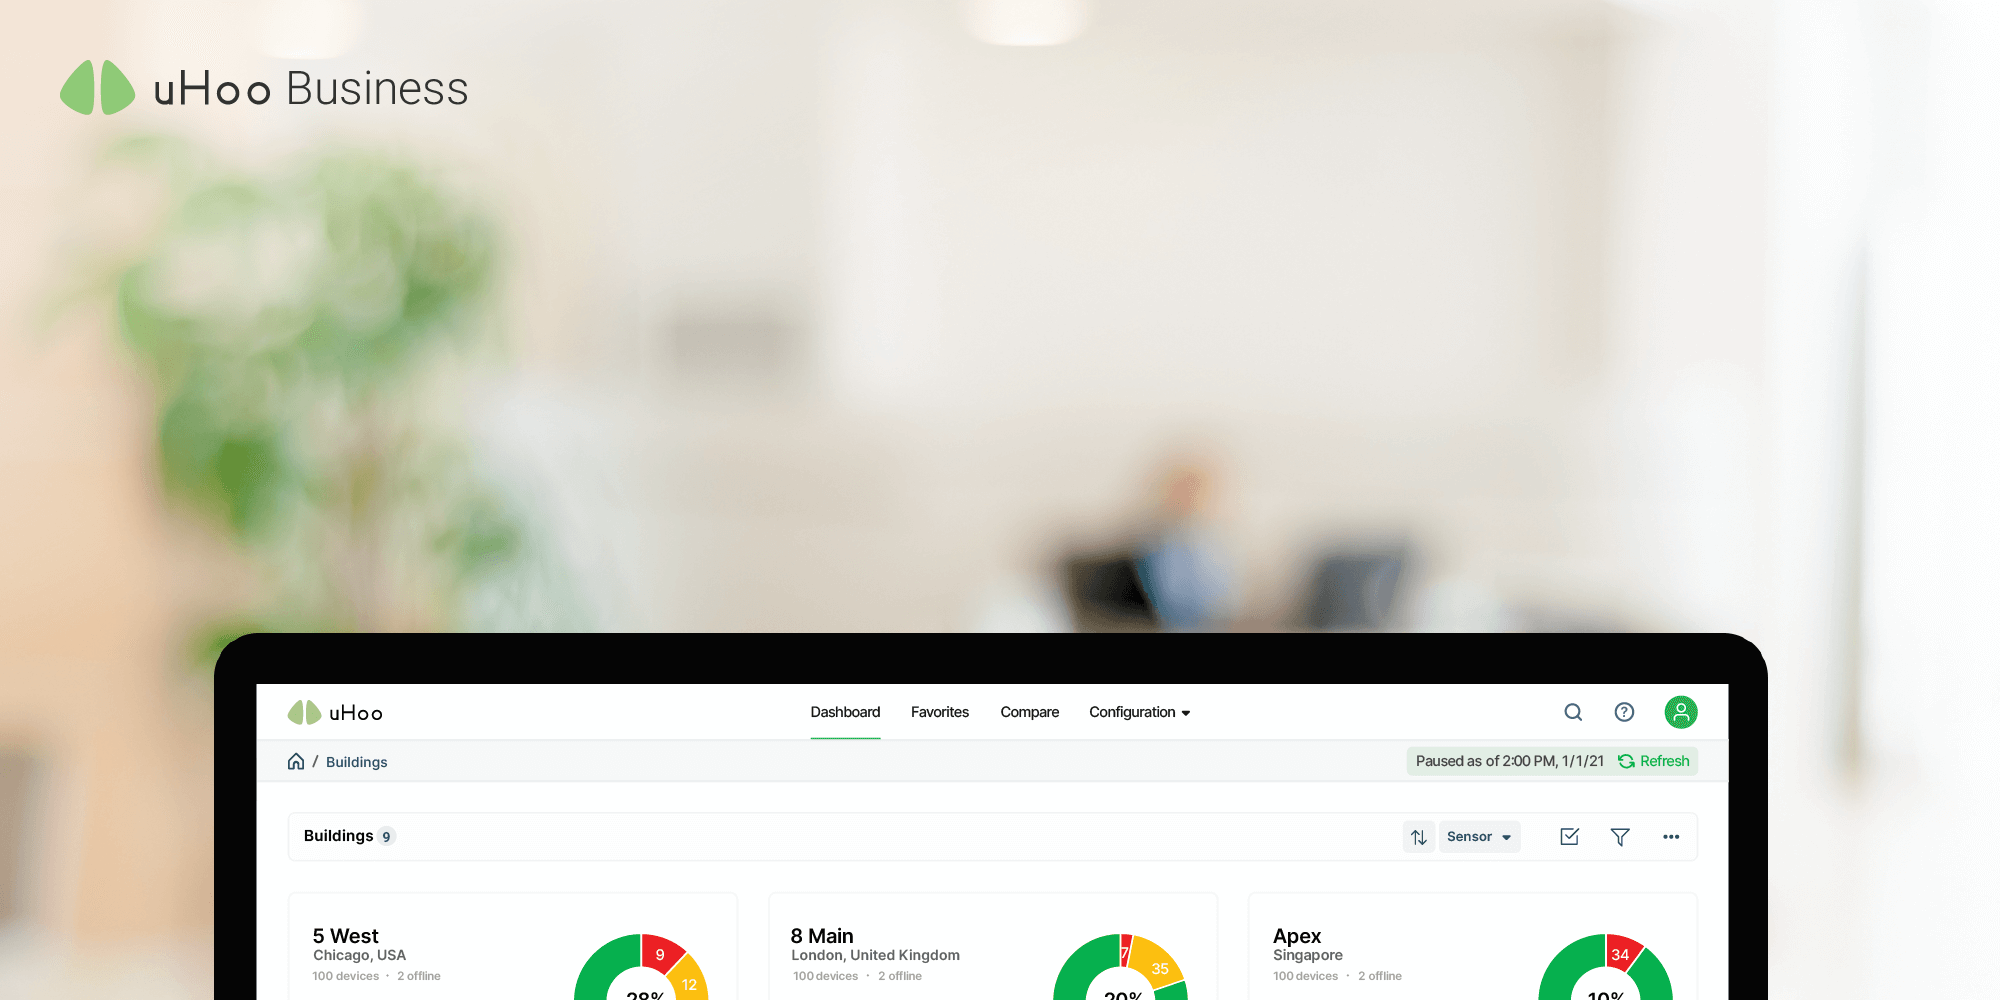
uHoo Business Dashboard
With the uHoo Business Dashboard, the air now becomes visible. This platform provides a detailed visualization of a building’s indoor environmental quality and arms our business clients with the knowledge that are greatly essential to control the sources of indoor air pollution, promote smart energy consumption, and create an efficient indoor environment that thrives.
The uHoo Business Dashboard is accessible via desktop or mobile devices. Take a look at its features and the advantages it brings your business:
Simple and Easy-to-use

- Get a clear overview of your environment across all your locations in real-time, minute by minute.
- Locations are color-coded based on the safety thresholds you’ve set and customized.
- Quickly identify locations that need immediate attention and discover IEQ parameters you’re doing well in and having issues with.
Monitoring and analytics in real-time and over time

- Dig deep and view real-time readings of every parameter in every location
- Understand changes in every location using trends to know what you can do and prevent issues in the future.
- Easily switch trends across sensing parameters and across time periods.
Get a 3D view of your building

- This feature allows you to drill down to a specific building and see the overall environment per floor
- Easily analyze the performance of each location per floor to identify which floors need attention
- Buildings and locations automatically scale as you install more uHoo devices
Visualize your building’s IEQ performance based on your floor plan

- Upload floor plans to create environment maps and identify exactly where issues are and what action should be taken in that specific location
- Video playback of changes over time to see when problems occurred and how to prevent them
Customize alerts for each parameter and location

- Create alerts for every device or group of devices based on specific parameters or threshold
- Customize when (minute by minute, hourly) and where to receive alerts (email or mobile push notification)
User management system to enhance data security

- Assign roles and responsibilities to specific people to enhance accountability on building and facilities management
- Ensure data and devices are accessible only by users you provide access to
Share your building’s IEQ performance

The dashboard also generates a QR code and a URL that enables you to distribute and display your indoor environmental quality readings to the public. This helps raise awareness about indoor air quality,increase public engagement, and make collaborative decisions to improve the environment where you and your employees work and flourish.
As the saying goes “anything that is measured and watched, improves”. Continuously track your IEQ and intuitively start improving the results. Monitoring IAQ and sharing the results can also help you obtain scores to achieve green and healthy building certifications such as GreenMark, LEED, and WELL.
While optimizing an entire building or an office’s indoor environmental quality may be a complex task, uHoo Business guarantees to make everything smooth and easy for you.